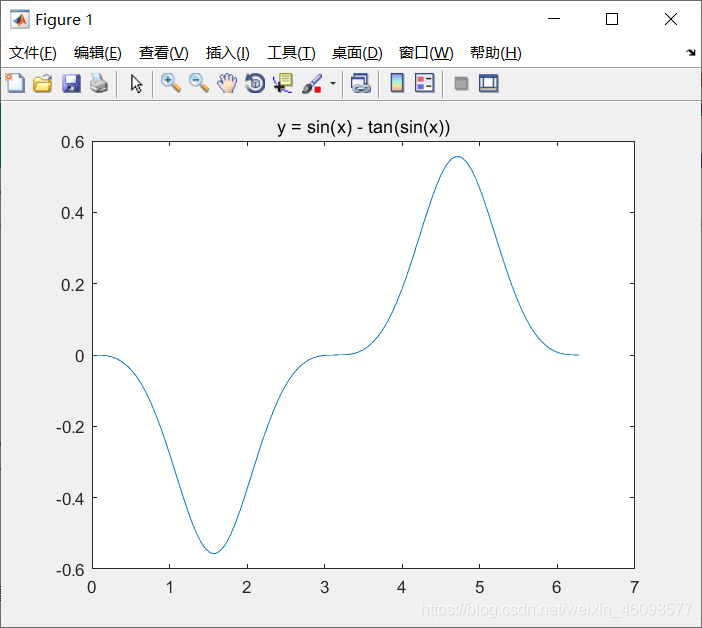
% 绘制 x = linspace(0,2*pi); y = sin(x)-tan(cos(x));
plot(x,sin(x)) hold on plot(x,cos(x)) hold on plot(x,tan(cos(x))) hold on plot(x,y) hold off title('添加图例') xlabel('X(m)') ylabel('Y(m)') % 按绘图顺序添加图例 legend('y = sin(x)','y = cos(x)','y = tan((cos(x))','y = sin(x) - tan(cos(x))')
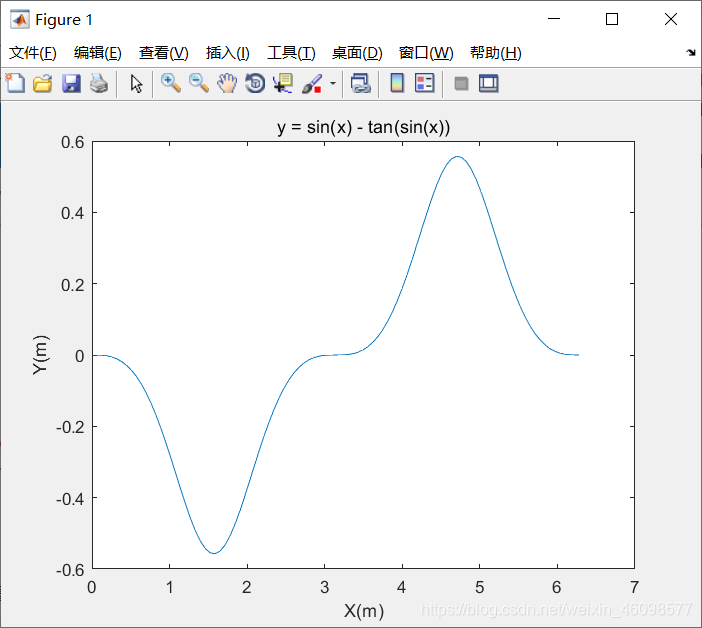
% 绘制 x = linspace(0,2*pi); y = sin(x)-tan(cos(x));
plot(x,sin(x)) hold on plot(x,cos(x)) hold on plot(x,tan(cos(x))) hold on plot(x,y) hold off title('添加图例','FontSize',20) xlabel('X/(m)','FontSize',15) ylabel('Y/(m)','FontSize',10) % 按绘图顺序添加图例 legend('y = sin(x)','y = cos(x)','y = tan((cos(x))','y = sin(x) - tan(cos(x))')